Learning analytics for an online course
A full CRISP-DM study of seven runs of a FutureLearn MOOC, from 61 raw files to a clear picture of who signs up and who stays.
- Year
- 2023
- Context
- Data science, Newcastle University
- Tools
- R, ProjectTemplate, dplyr, ggplot2, R Markdown
The aim
Use CRISP-DM to understand the learners on a massive open online course (MOOC) run on FutureLearn, across seven runs of the course.
What we did
- Triaged 61 raw data files down to the 7 that answered the business question, then documented why each one was kept.
- Built a reproducible analysis in R with ProjectTemplate, dplyr and ggplot2. The report is written in R Markdown, so it rebuilds from the raw data in one step.
- Followed each CRISP-DM stage in turn, from business understanding through data preparation to evaluation.
What we found
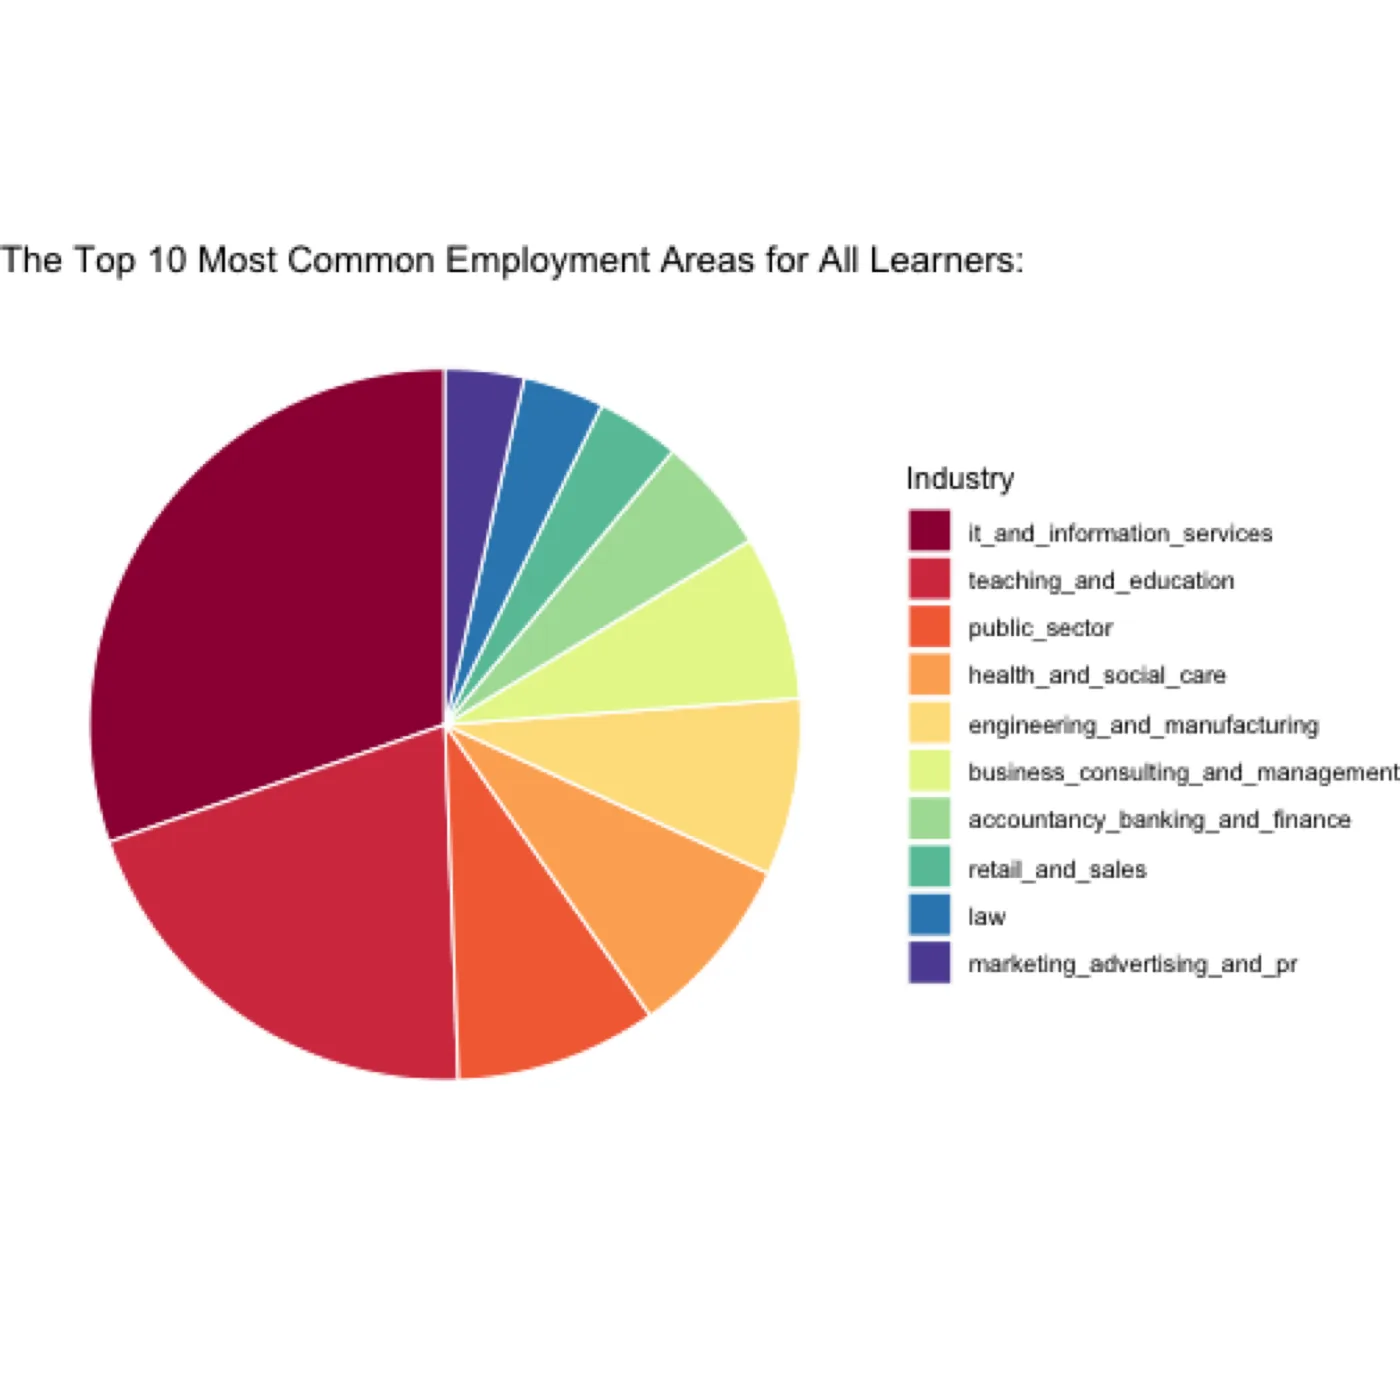
- IT and information services was the most common employment area among learners, followed by teaching and education, then the public sector.
- The share of employed learners fell from run to run, except in run 5.
These patterns tell the course team who to design for and where to promote the course.